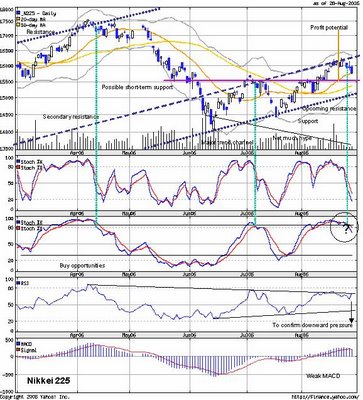
 Based on the technical analysis of the recent price movement on the Nikkei 225 chart, we believe that this index may have found its short-term peak on top of the secondary price channel. Other oscillators indicated that this index is within quite an overbought zone, with the RSI finding resistance to its own trend line, and also due to the likes of a weak MACD. Buying momentum has been weak as well. In addition, the main trigger would be on the tendancy for the level to fall with accordance to its slow stochcastics present elevated region. To sum it up, if the series of economic data from the US markets were to be negative, it will definitely help exacerbate on the tumble of the Nikkei 225. Furthermore, we reckon that oil price may rise to preceeding levels within the next few weeks, this may also add on to the downward pressure.
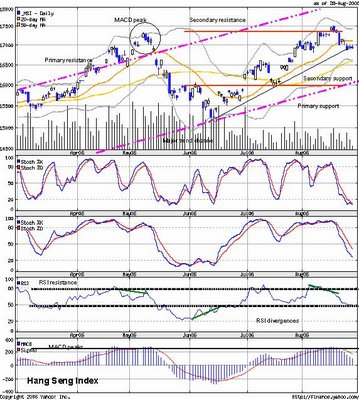
As for the HSI, we are mixed on the direction of where the index will be heading. On the basis of the occurences that we had noticed on the sentiment index, we are more inclined to the bears for the HSI at this moment. We will need to excercise more caution before hopping on.
SGX stockwhiz competition
Market play changed
Capitaland
Wednesday, August 30, 2006
Visual investing on Nikkei and HSI
Posted by
the street analyst
at
8/30/2006 03:57:00 AM
![]()
Subscribe to:
Post Comments (Atom)
No comments:
Post a Comment